

 Slovensky (EUR)
 Česky (CZK)
 Magyar (HUF)
Blood pressure, ECG and HRV measurements: what the results show
Blood pressure, ECG and HRV measurements: what the results show
Blood pressure, heart rate, the heart’s electrical signal and the pulse wave: different measurements, different information.
Blood pressure, heart rate, ECG and heart rate variability (HRV) describe different aspects of how the heart and circulation work. This guide explains what each method measures, how an electrical recording differs from a pulse wave, and why a number or colour-coded score alone is not enough for a diagnosis.
Article contents Select a section to open it; select it again to close it.
01What does a measurement show, and what is a diagnosis?
What does a measurement show, and what is a diagnosis?
When people see a number or coloured graph on a device, they naturally want to know whether they are ‘all right’. Different devices, however, measure different phenomena: pressure in an artery, the heart’s electrical signal, heart rate, the intervals between beats or the shape of a pulse wave. Under a microscope, we observe the appearance of a particular drop of blood.
Indicative measurements and observations can help you ask better questions, track changes over time and seek professional advice when appropriate. A result from one device does not automatically establish a diagnosis, prognosis or decision about medication.
| Method | Result and main limitation |
|---|---|
| Blood pressure | Systolic and diastolic pressure in mmHg. A single reading neither confirms nor rules out hypertension; correct technique and repeated measurements matter. |
| Heart rate | The number of beats per minute. Heart rate alone does not identify the type of rhythm disorder or determine overall heart health. |
| ECG | The heart’s electrical activity. The information obtained depends on the number of leads and the duration and quality of the recording; a short ECG may miss an intermittent arrhythmia. |
| ECG-derived HRV | Variation in the intervals between heartbeats, usually after removing artefacts and abnormal beats. The result depends on the metric used and the measurement conditions. |
| Pulse wave and PRV | An optical sensor detects pulsatile changes in tissue; PRV describes the intervals between pulses. It is not automatically interchangeable with ECG-derived HRV. |
| A drop of blood under a microscope | The appearance of a particular sample. The image alone does not determine laboratory blood viscosity or confirm arterial plaque. |
02Blood under a microscope: what can we actually see?
Blood under a microscope: what can we actually see?

Microscopic observation may reveal red blood cells, their shape, their distribution in the sample and sometimes other structures. The image is affected by sample preparation, time since collection, microscope settings and the sample itself. A photograph therefore describes what was visible in that particular sample.
A drop of blood viewed under a conventional light microscope cannot reliably diagnose ‘thick blood’, atherosclerosis, a specific vitamin deficiency, systemic inflammation or serious disease. Blood counts and clotting are assessed using appropriate laboratory tests in a medical context.
Read article 01 – What can a drop of blood under a microscope show? →
03Blood pressure: the upper and lower numbers
Blood pressure: the upper and lower numbers
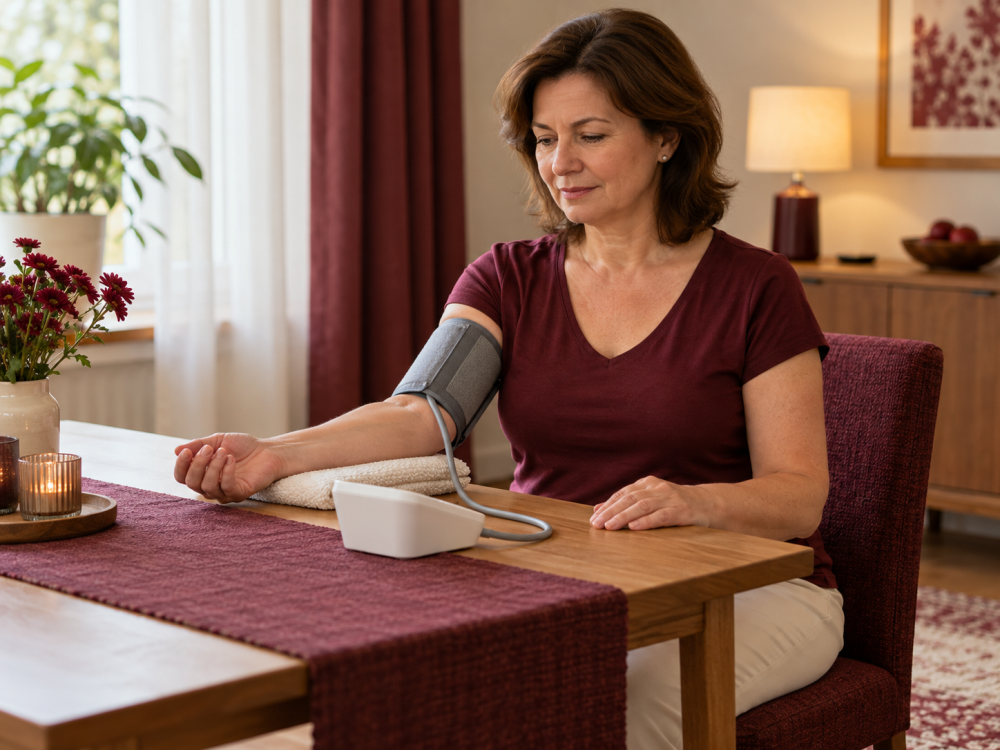
An upper-arm blood pressure monitor measures systolic and diastolic pressure in mmHg. The upper number describes pressure when the heart contracts; the lower number describes pressure between contractions. Under the 2024 ESC guidelines, hypertension corresponds to a home average with systolic pressure of at least 135 mmHg or diastolic pressure of at least 85 mmHg. This means an average of correctly performed measurements, not a diagnosis based on one number; a healthcare professional should assess the result and next steps. [1]
Blood pressure is generally considered low when it is below 90/60 mmHg; its significance also depends on symptoms, such as dizziness or fainting. New weakness, falls or feeling very unwell should not be judged by the number alone.
Use a validated upper-arm monitor with the correct cuff size. Sit quietly for at least five minutes beforehand, avoid talking, support your back and arm, and keep your feet flat on the floor. Place the cuff on your bare upper arm at heart level. Avoid exercise, smoking and caffeinated drinks for 30 minutes before measuring. Take two readings one minute apart and record them. [2] See the full procedure in article 08 – Blood pressure →
04Heart rate: when is it fast or slow?
Heart rate: when is it fast or slow?
Heart rate is the number of beats per minute. A commonly cited resting range for adults is 60 to 100 beats/min. Exercise, stress, pain, temperature, hydration, medication and fitness can affect the value.
Repeated readings above 100 beats/min at rest or below 60 beats/min at rest need to be interpreted in context. A slower heart rate in a well-trained person does not necessarily mean disease; palpitations, fainting, chest pain or breathlessness deserve medical attention even when the reading initially looks ‘normal’.
A blood pressure monitor displays heart rate but cannot reliably identify every type of rhythm disorder. Assessing heart rhythm requires an ECG recording and, where appropriate, further investigation.
The American Heart Association provides guidance on the usual resting heart rate range. [4]
05WIWE: a short ECG and heart rhythm recording
WIWE: a short ECG and heart rhythm recording
WIWE records a short ECG. Its output may flag an irregular rhythm or atrial fibrillation, a fast or slow heart rate, and its own measure of ventricular heterogeneity. This relates to the ventricles’ bioelectrical properties, not the elasticity of the vessel wall.
A short recording may help document symptoms occurring at the time of measurement. If an arrhythmia occurs intermittently, a recording without abnormalities does not rule it out. Algorithmic alerts require professional assessment; do not stop medication on their basis.
The specific model, intended use and limitations should be assessed using its instructions. App results require professional interpretation and do not replace a full assessment. Official explanation of WIWE metrics [6]
A short portable ECG, a 12-lead ECG and a Holter recording are different tests. An ECG records the heart’s electrical activity; the number of leads and recording duration determine what information can be obtained. For intermittent symptoms, a clinician may choose longer ambulatory monitoring. [5]
06Smart Pulse: the peripheral pulse wave
Smart Pulse: the peripheral pulse wave

Smart Pulse uses a finger-mounted optical sensor and software processing of the pulse signal. The app reports metrics relating to stress and peripheral circulation; terms such as ‘peripheral elasticity’ refer to a calculation performed by the particular software. This signal differs from an ECG. The device does not perform vascular ultrasound, directly show plaque or measure laboratory blood viscosity.
Compare results under similar conditions: at rest, with similar finger temperature, a correctly positioned sensor and minimal movement. A change in a graph between two measurements is not, by itself, evidence of a change in disease.
Medicore’s current Google Play app description identifies Smart Pulse as a device for wellness use that should not replace clinical assessment. The documentation for the specific model and version is what matters. [7]
07Max Pulse: the pulse wave, autonomic nervous system and HRV
Max Pulse: the pulse wave, autonomic nervous system and HRV
Max Pulse processes a pulse wave from a finger sensor. According to the device’s public description, its report includes waveform type, average heart rate and derived measures of vascular properties. Other software outputs describe variability in pulse intervals and estimates relating to the autonomic nervous system or stress. These are not direct measurements of nerve activity. [8]
HRV and PRV must be distinguished. HRV is derived from an electrical recording of heartbeats, whereas PRV is derived from intervals between peripheral pulses. PRV is also affected by pulse wave transmission and circulatory properties. A 2025 study comparing optical and ECG measurements in 931 adults found differences between these methods; a result from a particular optical sensor cannot therefore automatically be substituted for ECG-derived HRV. [9]
Variability results change with breathing, posture, recording duration and measurement conditions. A higher value is not universally better. Without the metric name, unit and signal quality, a single number cannot establish a diagnosis or a precise state of ‘nervous system exhaustion’. Compare results using the same procedure and interpret unusual findings in a healthcare context.
08What do grades 1–7 and numbers up to 100 mean?
What do grades 1–7 and numbers up to 100 mean?
A Max Pulse report may display a pulse waveform type from 1 to 7 together with the distribution of beats across these types. These are software categories describing pulse wave shape. They are not clinical stages of atherosclerosis and the number alone does not prove that an artery is narrowed.
A report may contain several separate scores, including stress-related metrics. The number 100 alone does not mean 100% health or a universally optimal result. The direction, range and meaning of a scale must be interpreted using the exact metric name and instructions for the particular report version. Scores from different devices are not automatically comparable.
A low ‘peripheral elasticity’ result on Smart Pulse does not automatically mean vascular disease. Repeat the measurement under comparable conditions and discuss the result with a healthcare professional if you have symptoms.
09How can you build a useful picture from the results?
How can you build a useful picture from the results?
- Record the circumstances: time, rest or exercise, medication, symptoms and measurement technique.
- Compare like with like: for example, home blood pressure at the same time using the same device.
- Respond to unusual findings according to their significance: repeatedly raised blood pressure, an unusual heart rate or an ECG alert warrant appropriate professional advice, not self-treatment.
- Keep the methods distinct: a microscopic image, an ECG and a pulse wave provide different information; their scores cannot be added together.
For context on how these methods relate to circulatory health, see the main article 03 on the heart and blood vessels. Viscosity and blood flow are explained in article 02 on microcirculation.
10When should you seek help without delay?
When should you seek help without delay?
If you develop chest pain or pressure, sudden severe breathlessness, fainting, paralysis, speech difficulties or other signs of a stroke, do not wait for another indicative measurement. Call your local emergency number immediately; in the EU, call 112.
If you have no acute symptoms but measure systolic pressure above 180 mmHg or diastolic pressure above 120 mmHg, repeat the measurement after resting for at least one minute. If it remains this high, contact a healthcare professional without delay. With chest pain, sudden breathlessness, speech difficulties, weakness or other acute symptoms, call your local emergency number immediately; in the EU, call 112 and do not wait to repeat the measurement. [2]
11Frequently asked questions
Frequently asked questions
Can a microscope show whether I have ‘thick blood’?
Not reliably. Assessing a blood count and other parameters requires appropriate laboratory testing.
Does a WIWE recording without abnormalities rule out an arrhythmia?
No. A short recording will miss a rhythm disorder that does not occur during the measurement. Consult a clinician if you have symptoms.
Is a Max Pulse score of 100 the best result?
Not in general. The number 100 alone does not mean 100% health. Check the metric name and the instructions for the particular report version to understand the scale and its direction.
Is Smart Pulse the same as Max Pulse?
No. Their reports and outputs differ; always interpret a result using the exact device name and the specific report.
Is ECG-derived HRV the same as variability measured by a finger sensor?
Not automatically. A finger-mounted optical sensor derives intervals between pulses, which is PRV. These intervals are also affected by pulse wave transmission; PRV and ECG-derived HRV are not interchangeable in every situation.
Does one high blood pressure reading confirm hypertension?
No. Correct technique, repeated measurements and the healthcare context matter. Acute symptoms require immediate help rather than waiting for further home measurements.
12Sources and further reading
Sources and further reading
Guidance on blood pressure and clinical tests is listed separately from descriptions of individual devices. Device documentation explains its output; it does not, by itself, validate every clinical conclusion.
- ESC (2024): guidelines on elevated blood pressure and hypertension; thresholds for average home readings.
- American Heart Association: home blood pressure monitoring and what to do with very high readings.
- American Heart Association: low blood pressure and symptoms.
- American Heart Association: heart rate and its interpretation.
- NHS: ECG and ambulatory monitoring.
- WIWE: description of its short ECG, rhythm assessment and ventricular heterogeneity.
- Medicore: current Smart Pulse app description on Google Play.
- Max Pulse: description of its report and pulse waveform categories.
- Study (2025): differences between optical-signal PRV and ECG-derived HRV in 931 adults.
- Martínez-González-Moro et al. (2022): Max Pulse outputs before and after intense exercise in 53 runners.
The Max Pulse sports study examined changes in metrics after exercise; it did not validate the diagnosis of atherosclerosis or a precise measure of psychological stress in every person. [10]
Further context: Blood pressure – article 08 · Blood under a microscope – article 01.